The Solution
IstoVisio, Inc., a WVU spin-off company that created syGlass, a software that analyzes data collected from large multidimensional volumetric data — stacks of 2D images where the pixels have multiple values — uses virtual reality head-mounted displays to enable neuroscientists to visualize and explore their data in 3D. This software helps scientists make more accurate and quicker decisions by being able to explore their data more thoroughly.
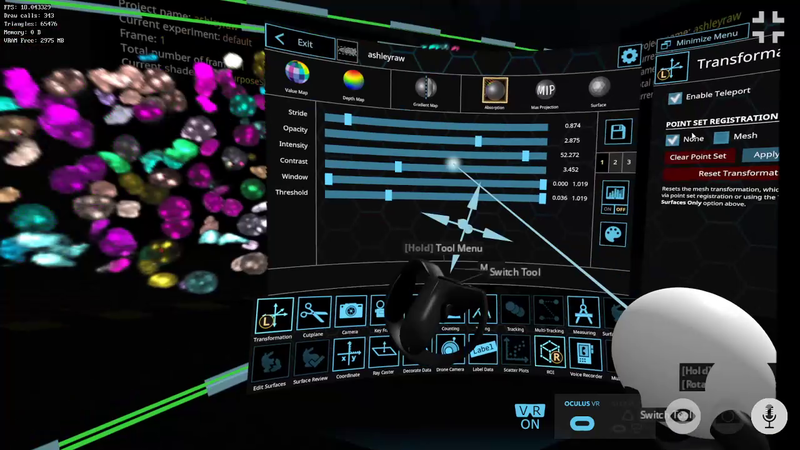
Neuroscientists collect 3D images of biological tissues to formulate research hypotheses. Often these scientists need to further process the 3D images to analyze what they see, which can be difficult if the 3D images are made of 2D surfaces.
IstoVisio, Inc., a WVU spin-off company that created syGlass, a software that analyzes data collected from large multidimensional volumetric data — stacks of 2D images where the pixels have multiple values — uses virtual reality head-mounted displays to enable neuroscientists to visualize and explore their data in 3D. Before IstoVisio, Inc. developed syGlass, neuroscientists would only see image slices of the data, which Gianfranco Doretto, associate professor in the Lane Department of Computer Science and Electrical Engineering, said is not always accurate.
“While we developed syGlass to satisfy the needs of neuroscientists, we continue to find other application domains in need of exploration and analysis of volumetric data,” Doretto said. “In general, structural biologists collect and analyze this type of data. In clinical applications, CT scans and MRIs are better observed in virtual reality for different applications, like educational or surgical planning. At the Department of Energy, geologists have been using syGlass to analyze the internal structure of rocks through their CT scans.”